BYU’s defense in 2022 was not the best defense that we’ve seen come out of Provo. The rush 3, drop 8 no matter the down and distance approach effectively was exposed within a few weeks and then repeatedly pummeled week after week. The bloodiest period was a winless October when the defense could not get off the field easily and without being wounded, typically in the form of points.
In my mind, the play that defined the season was a 3rd and 11 against Arkansas when BYU had multiple such attempts to bring down KJ Jefferson and could not bring the knees down. Jefferson, fighting through several BYU defenders, miraculously stayed on two feet, looking more like Clark Kent as each second ticked by. As he scrambled away and connected with Trey Knox for a 36-yard gain, BYU’s nationwide fan base hopped on a 5 second roller coaster, starting with hopeful exuberance and ending with depressed anguish.
Talk about weeping and wailing and gnashing of teeth!
That play started with the defensive line, which is where all good defenses begin. And, when the defensive line does not complete the play, then the scramble begins. The next levels are likely out of position or have to make big efforts to get into position. Now, in that play, Tyler Batty created the initial pressure and almost made the sack.
I am a believer in Tyler Batty and expect him to have an even better year in 2023. So, I’m not hanging this all on Tyler Batty. And yet, everyone needs to get better on the defensive line. Collectively. Their best player, in my opinion, was Tyler Batty, and you can’t have your best player missing those plays in those moments. Those are the types of plays that, if repeated in 2023, could lead to a 4-8 season and a 2-7 record in Big 12 play.
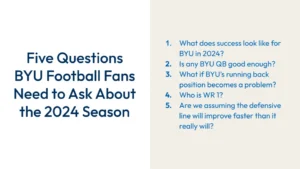
Where does the defense need to improve?
If BYU wants a puncher’s chance of competing in the Big 12, then the defense has to improve dramatically. That much is clear. Every BYU fan knows that. That’s why the defensive staff was almost completely overhauled and why several portal transfers were brought in at all three levels (defensive line, linebackers, and defensive backs).
Getting better starts with the defensive line. It doesn’t matter if you have Kyle Van Noy as a backer if your defensive line is going to give an automatic 5 yards every running play. If the game is won in the trenches, as they say, then make sure that you either have guys who build better trenches faster, or make sure that your general is directing you to build more strategic trenches. Or, if you’re lucky, or called the Georgia Bulldogs, you have both.
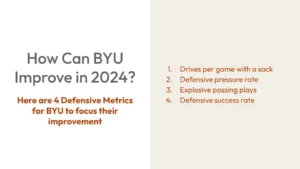
So, what to make of this? Well, I took a look at five areas in which BYU’s defensive line can improve. I looked at 2022 performance and compared BYU’s performance against the new Big 12, the nation, and some benchmark programs such as Georgia, Alabama, Michigan, Penn State, and yes, even that team up north, Utah.
Here were the five statistical categories I analyzed:
- Sacks
- Tackles for Loss
- Defensive Stuff Rate
- Defensive Line Yards
- Defense Rushing Plays Success Rate
The first two stats are common and most fans will know. The last three stats are advanced metrics that come from ESPN data (thank you cfbfastR and College Football Data!)
Definitions of the Advanced Metrics
Defensive Stuff Rate: This measures the percentage of running plays that are stopped at or behind the line of scrimmage.
Line Yards: This metric attempts to measure the number of running yards which are attributed to the offensive line. Yards are weighted as follows:
- Losses – 120%
- 0-4 yards from LOS – 100%
- 5-10 yards from LOS – 50%
- 11+ yards from LOW – 0+
In the case of Defensive Line Yards, this metric measures the number of running yards the defense allows the opposing offensive line to generate. The more yards allowed, the worse the defense performed.
Defense Rushing Plays Success Rate: is an efficiency metric pertaining to running that determines the success of a play. Successful plays meet one of the following criteria:
- the offense scored
- 1st downs which gain at least 50% of the yards to go
- 2nd downs which gain at least 70% of the yards to go
- 3rd and 4th downs which gain at least 100% of the yards to go
The lower the defense success rate, the better the defense as it was better at preventing the opposing offense from successful yard gainage.
Sacks
Sacks are exciting, and while they are not the end all, be-all of a defense, a team needs to be able to generate sacks with some regularity. BYU ranked a paltry 130th last year. At least they were better than Colorado. Putting one more defensive lineman on the front will help. Jake Hatch from Locked On Cougars had a good interview with Tyler Batty and also brokedown his thoughts on why the defensive line will be in a better position schematically to generate more sacks.
Tyler Batty could pop for 6-7 sacks this (2 last year). Sacks are usually momentum and drive killers, and they’re the type of plays that can make a difference in a game.
Where did BYU sit last year compared to other programs in the Big 12 and across the nation? As noted earlier, they ranked 130th in the nation in sacks per game. Look at this scatterplot where I’ve plotted the total points allowed against the number of sacks.
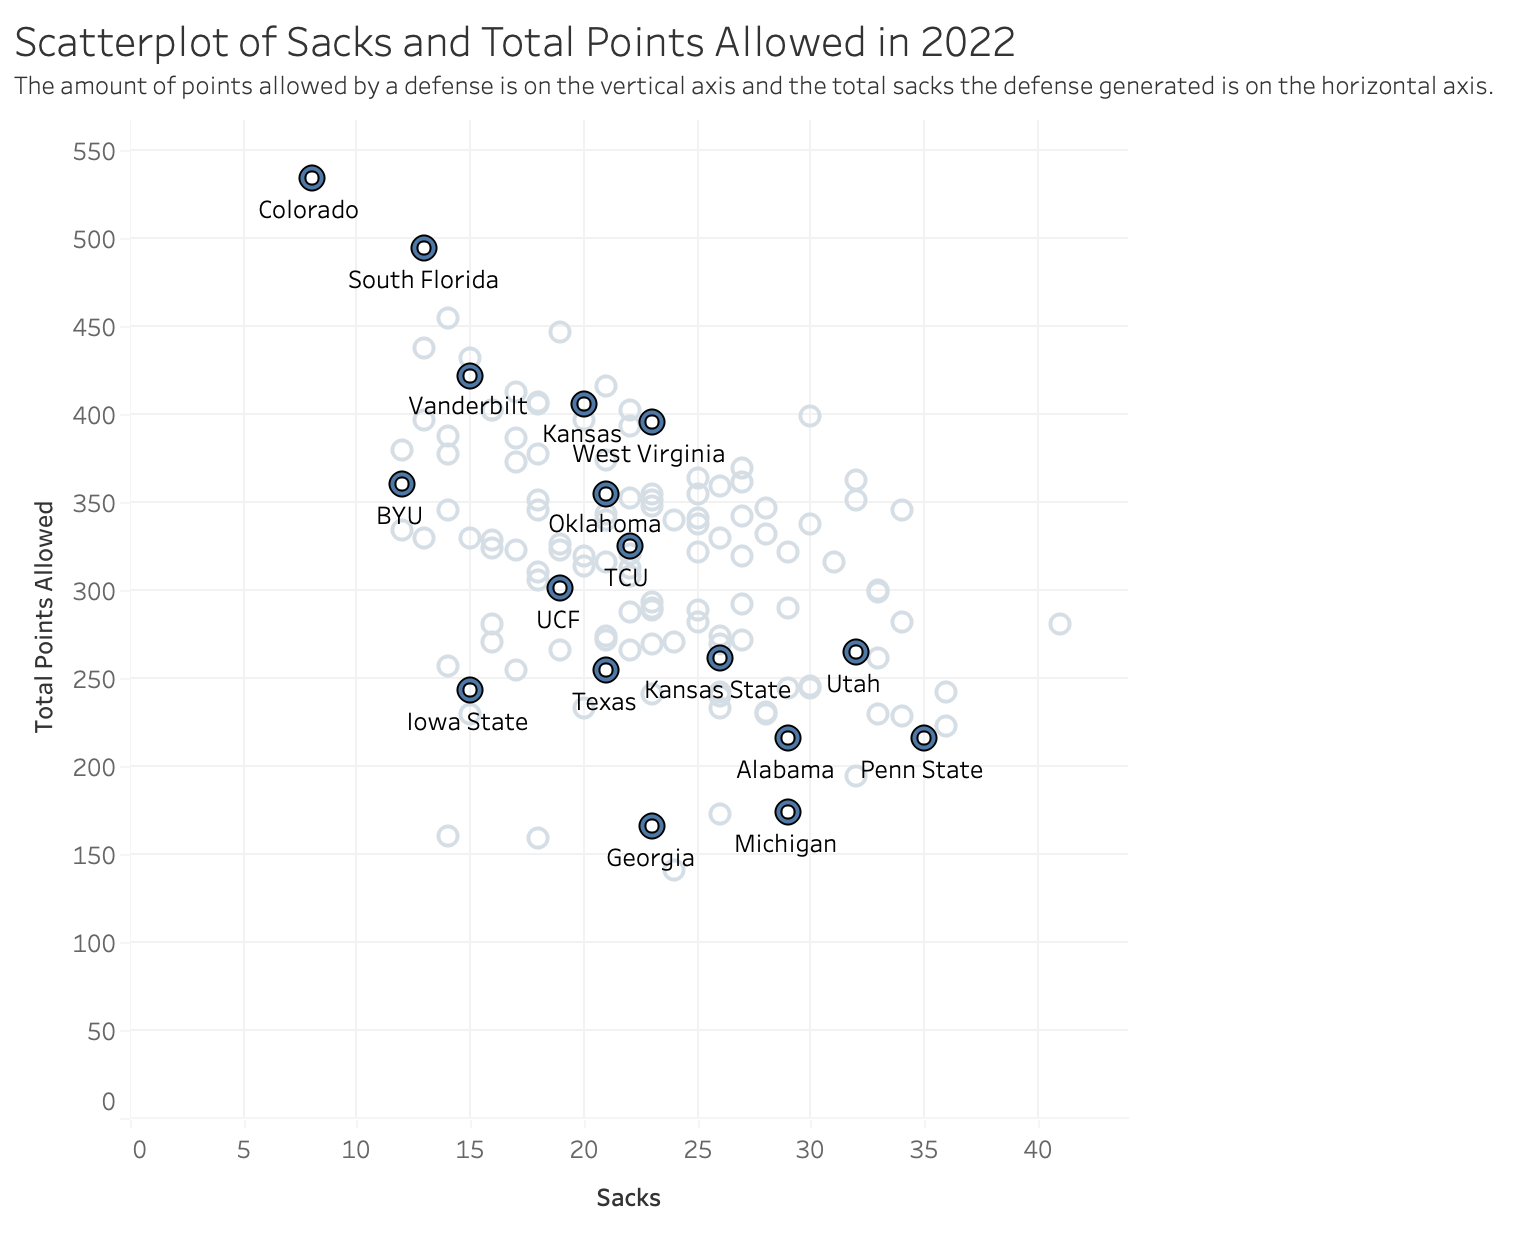
Here are a few takeaways that I observed from charting:
- BYU was not in the best of company (Colorado, USF, Vanderbilt, etc…)
- But, look at Iowa State – One of the best defenses in the country and in the Big 12, and they were in the lower percentiles of total sacks
- Georgia, Michigan, TCU, Penn State, Alabama, even Utah…range in their amount of sacks they generated.
Then, take a look at how BYU stacked up against the other Big 12 teams:
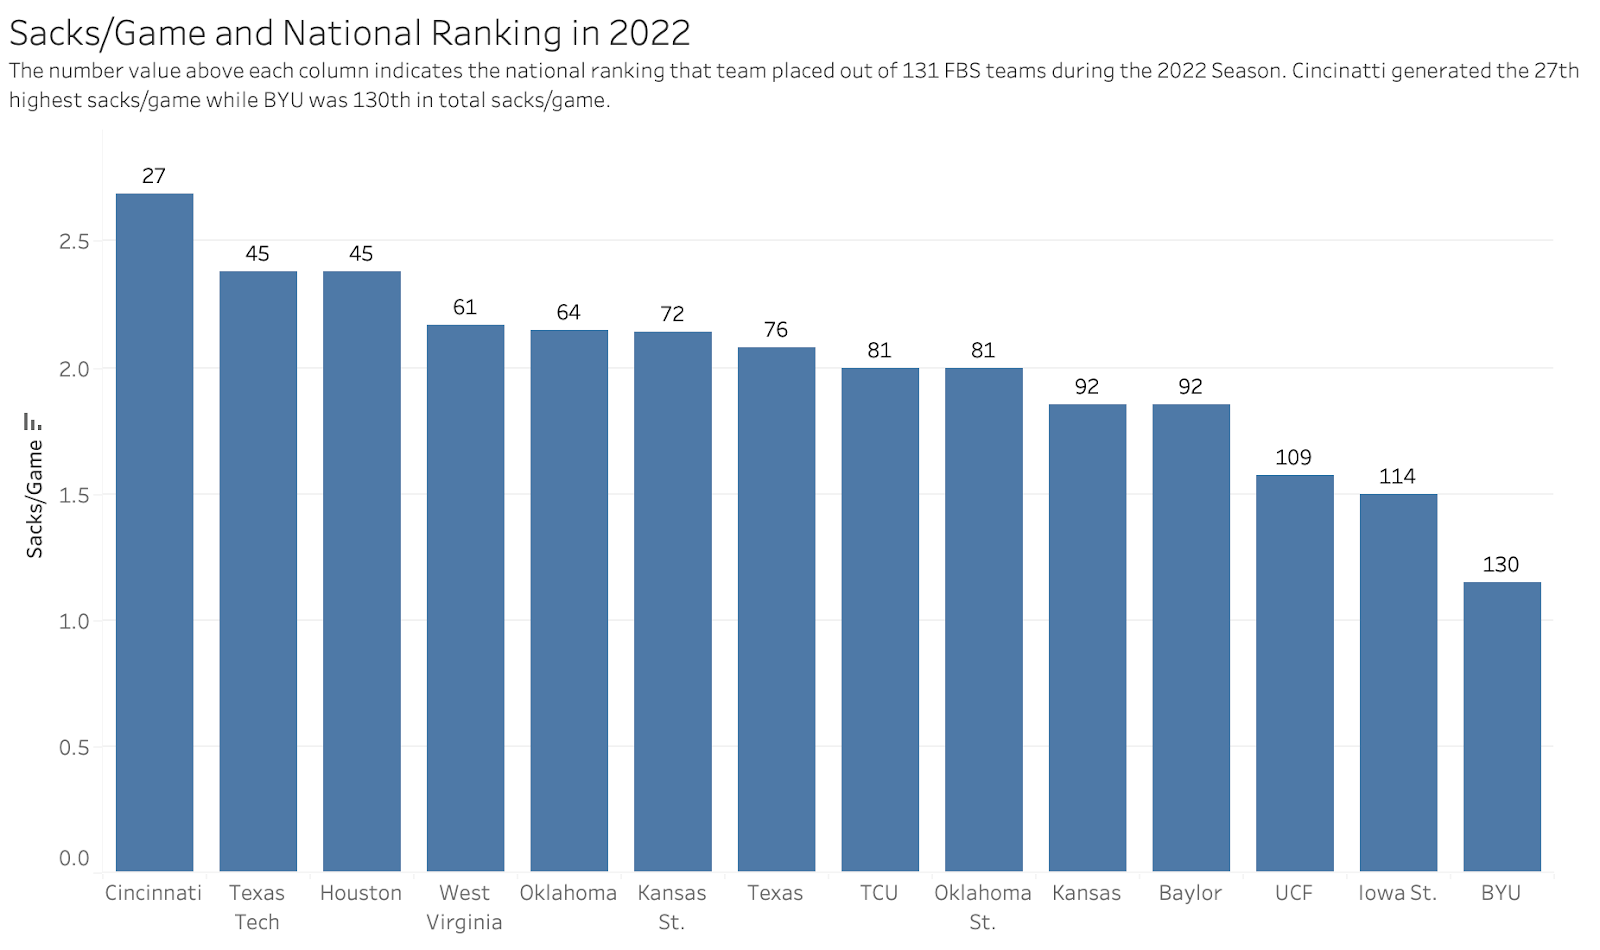
Cincinnati would have been the best last year amongst Big 12 teams. Besides Cincinati, there wasn’t a team that was dominant. But, almost half the league was twice as good as BYU…so, not great.
BYU absolutely needs to generate more sacks next year, and getting into the 20s would be a good start. That would put them at almost 2 per game.
Tackles for Loss
Why tackles for loss? Clearly, they are better than tackles for a gain. But, they indicate that a defensive line is generating pressure. Typically, a tackle for loss begins with the defensive line. From how they own their gap, to how they shed blocks, to how they simply do what they are supposed to do while the backers come clean up, it starts up front.
Tackles for loss is another indicator into the performance against the run game. This was another area in which BYU really needed to improve. Again, in a vacuum, this metric can tell one story that could lead the casual fan astray. So, it must be examined with an eye towards other defensive metrics as well. Nevertheless, a defense must find ways to get a healthy amount of tackles for loss.
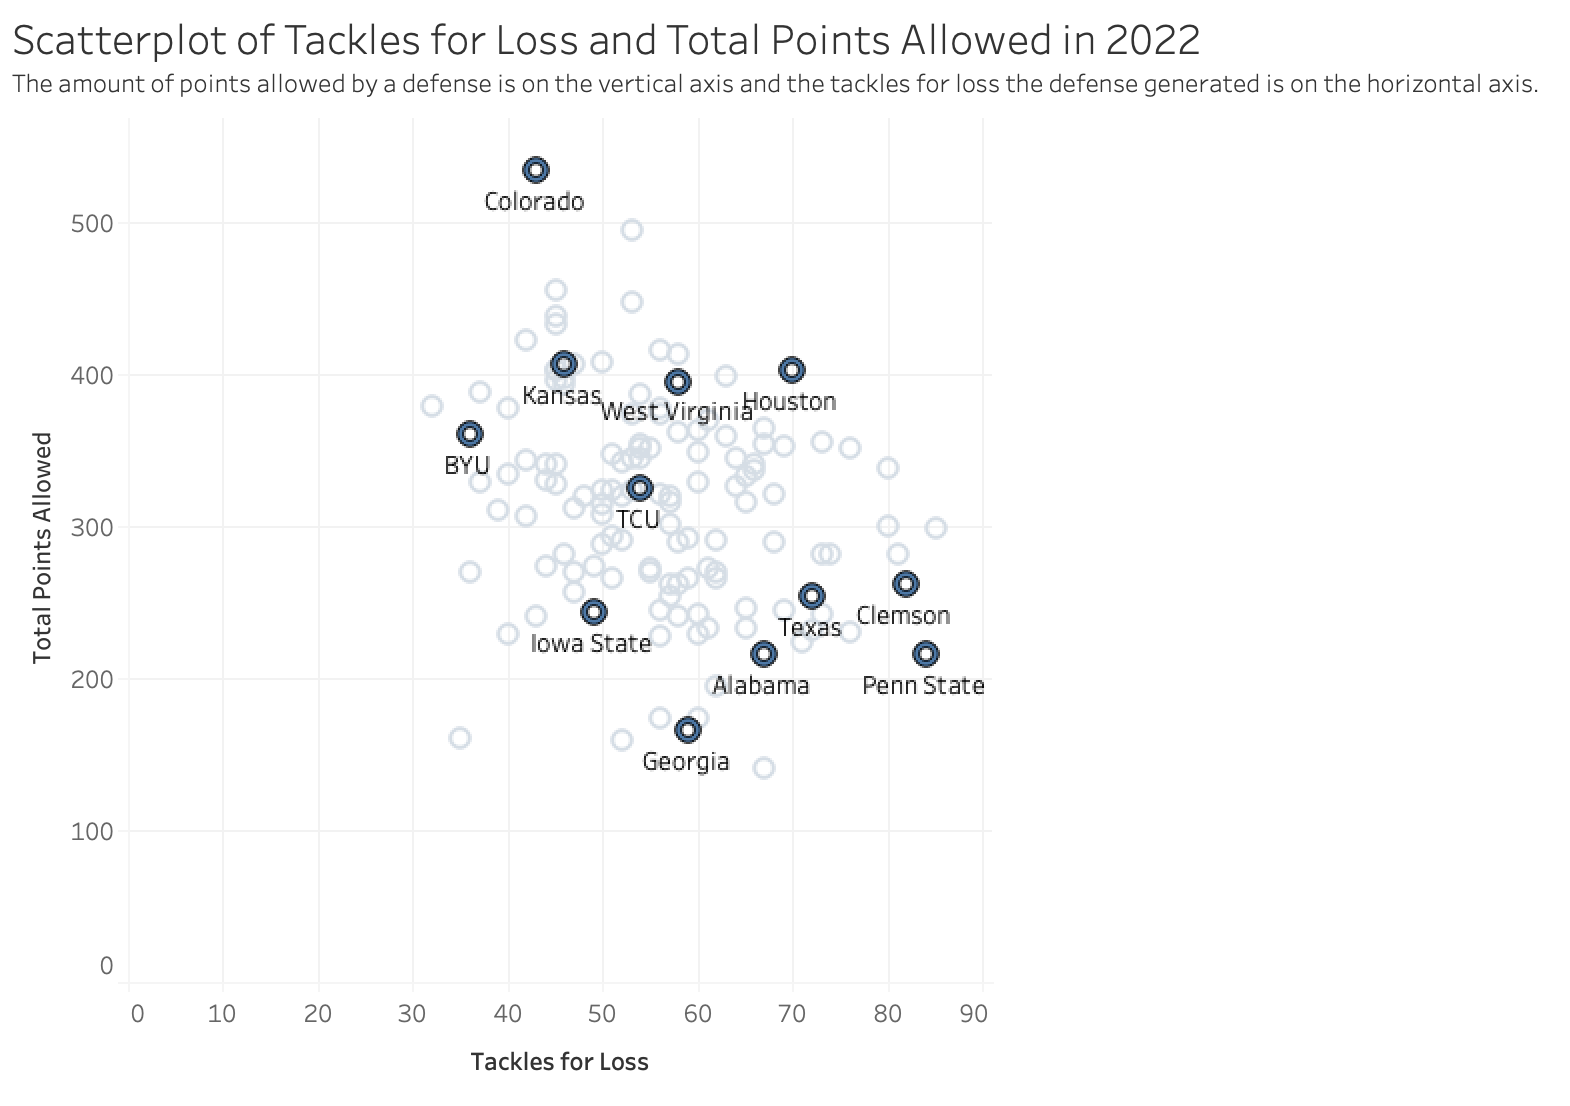
Here is a plot charting the tackles for loss and against total points allowed, and you will find a similar theme to that of sacks. Generally, the better teams get more tackles for loss and allow fewer points, while the teams with poorer defenses get fewer tackles for loss because they’ve basically opened the front door for the opposing offense to come right in and trample all over the house!
One note – TCU – they’re interesting to me. I’d describe the 2022 TCU team as a homemade rocket that is not going to fly 99 out of 100 times. But, that one time that the fuse lights and the rocket happens to ignite and successfully get lift off, it’s going to the moon.
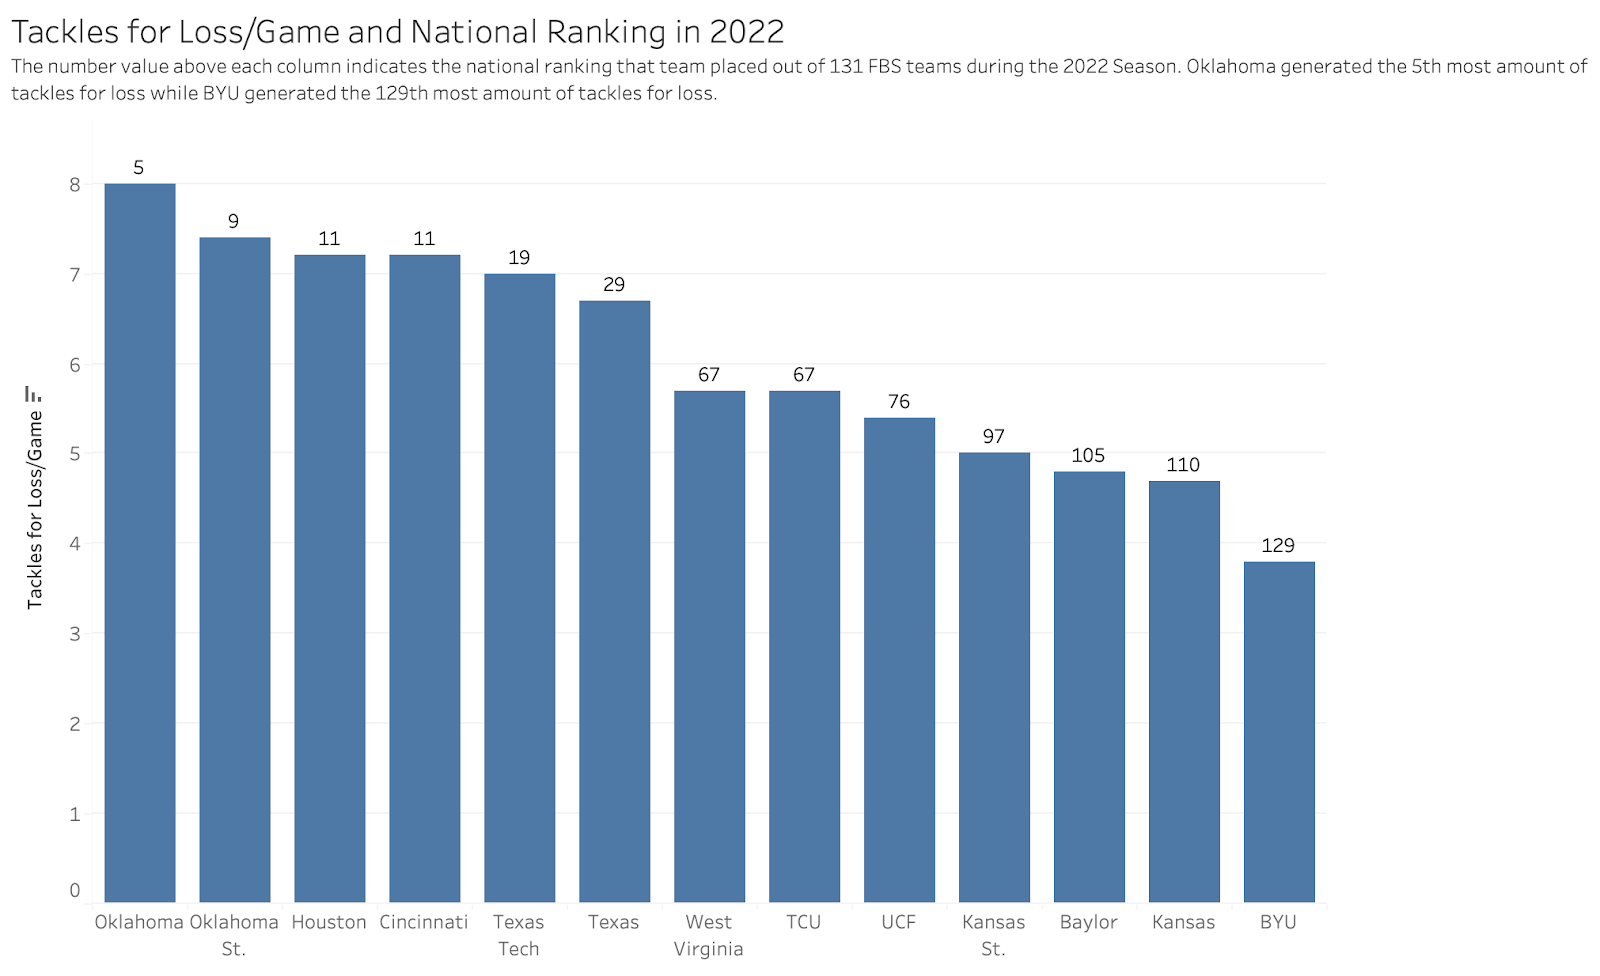
When we look at the national rankings for the Big 12 teams, we see why we can’t look at this metric in a vacuum. Oklahoma was one of the best, yet they also had a pretty bad defense. They allowed gobs and gobs of points. BYU finds itself at the back of the pack again…
Interestingly, Brent Venables was on BYUTV’s SportsNation and mentioned he liked the aggression he saw from his line in the form of tackles for loss, yet that was about where the good things ended. Therefore, they brought in quite a bit from the transfer portal.
Defensive Stuff Rate
This metric defines the percentage of the time that the defense stops the opposing offense at or behind the line of scrimmage. So, the higher the defensive stuff rate, the better that defense is doing. Better at doing stuff, ha ha. Doing the right stuff that is.
In the scatter plot that follows, pay attention to the following:
- Some, but not all, of the better teams have a higher defensive stuff rate percentage
- Georgia, Clemson, Utah, Penn State – these were all NY6 or CFP teams
- But, Michigan and Kansas State, both conference champions, were middle of the pack
- Meanwhile, other teams, such as Iowa State, Texas Tech, and even Houston, scored high in this category
- BYU was not the worst in the country last year, but they were nearly twice as bad as the best in the country, and about 50% worse than much of the Big 12
- As you are likely concluding, defensive stuff rate is but one metric by which to measure a defense. It is a useful metric, but it is not the end all, be all of defensive metrics.
The graph clearly shows that BYU has room for improvement. Schematically, putting 4 guys on the defensive line gives you a better chance at a good stuff rate. If you improve your stuff rate, then the theory goes that you set up for your defense more 2nd and 10 situations vs 2nd and 4 situations.

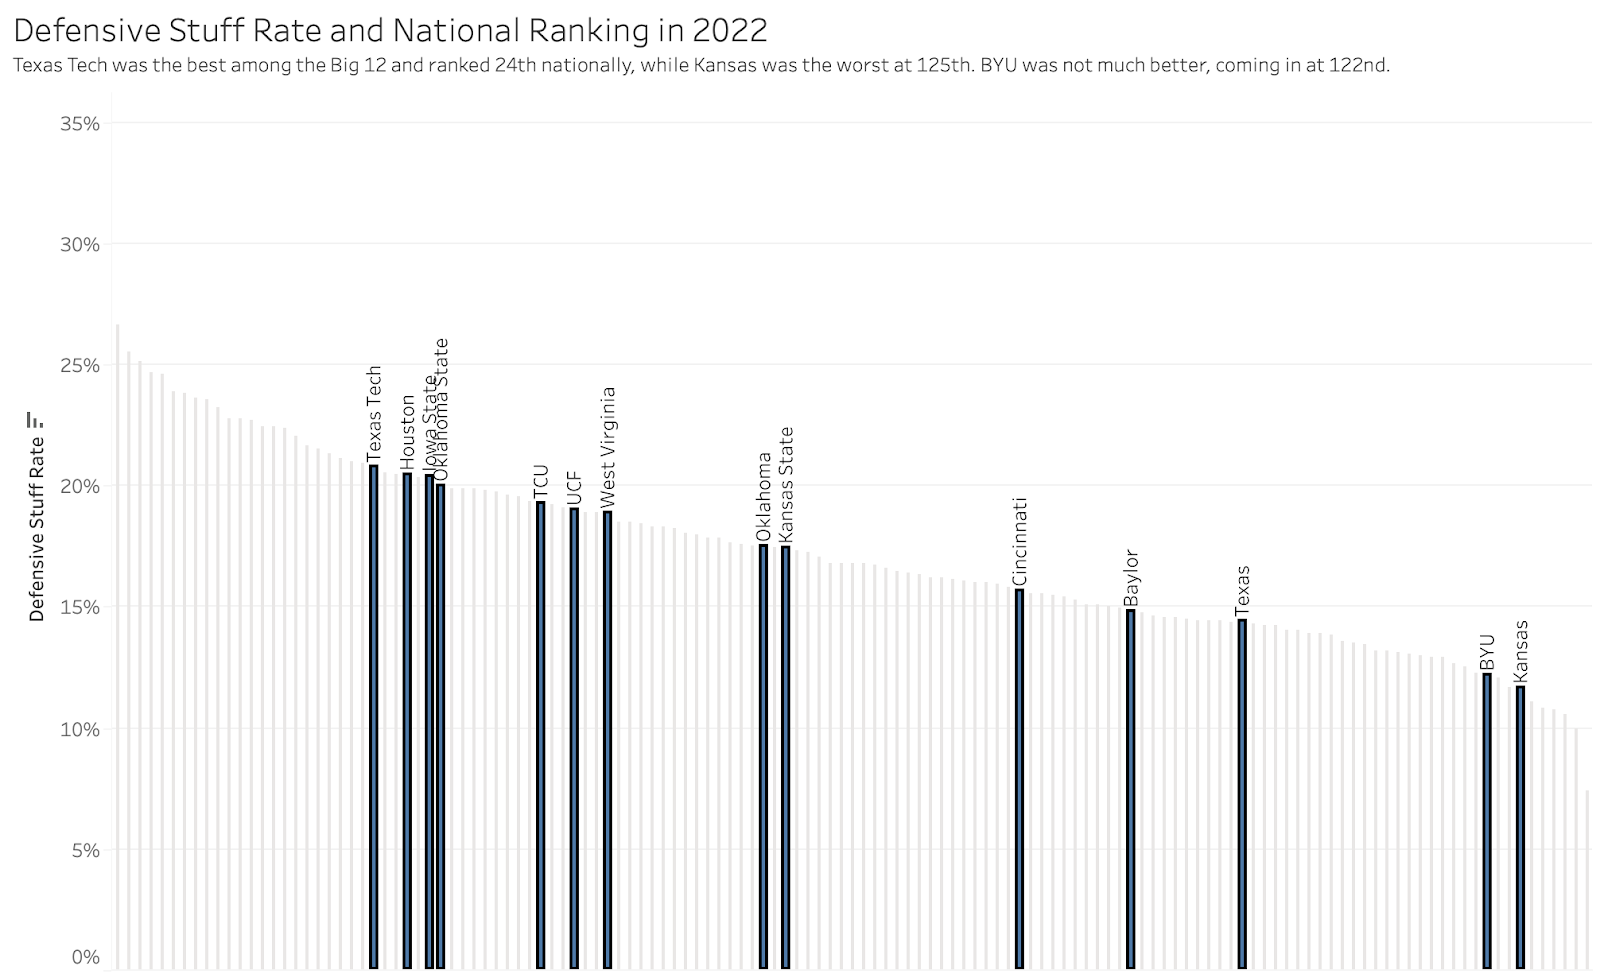
When we look at the national rankings of defensive stuff rate, Texas Tech was the best Big 12 team, coming in at 24th nationally. Kansas was the worst team, coming in at 125th nationally. 3 spots ahead of Kansas is where BYU sits. So, while not the worst, clearly not the best. Texas Tech, Houston, Iowa State, and Oklahoma State are all lumped together up near the top of the Big 12 and inside the top 30 in the country. They were almost twice as good as BYU.
Three of those four teams are on BYU’s 2023 schedule. Oklahoma State brings in a new defensive coordinator while the other three schools return their defensive coordinators, so I would expect them to be strong against the run in 2023 again.
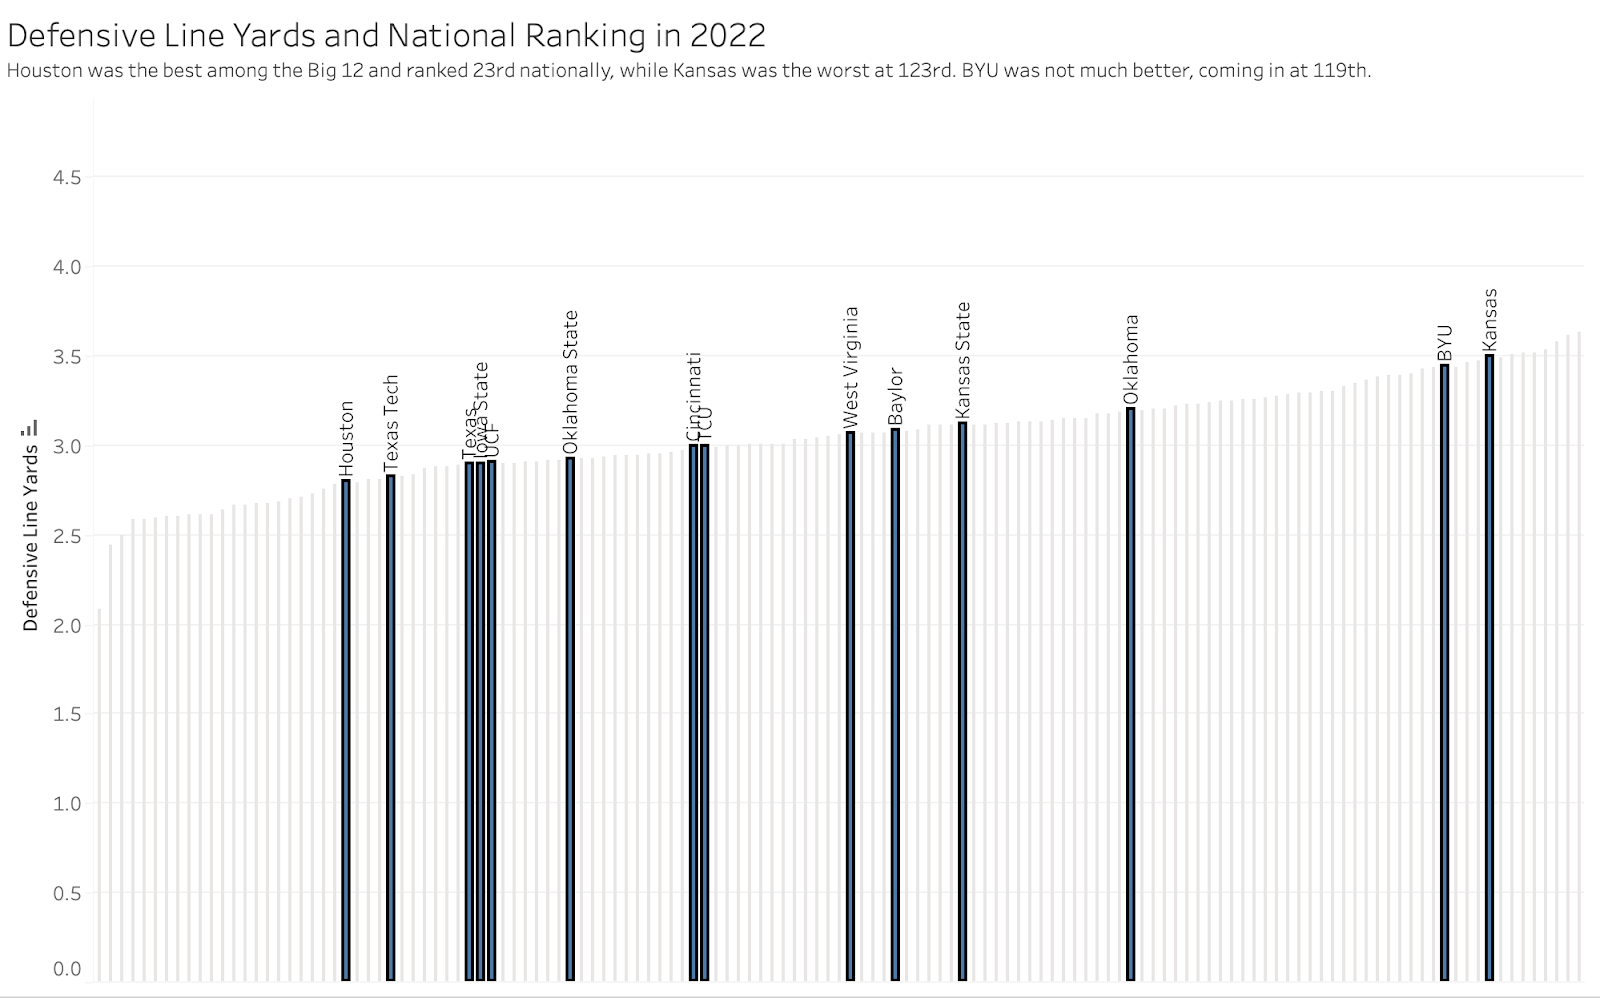
Defensive Line Yards
This metric is advanced, so it merits repeating the definition so that it crystalizes. For those of you who understand the metric, feel free to skip the next few paragraphs.
As described earlier, the metric line yards attempts to measure the number of running yards which are attributed to the offensive line. Yards are weighted as follows:
- Losses – 120%
- 0-4 yards from LOS – 100%
- 5-10 yards from LOS – 50%
- 11+ yards from LOW – 0+
Let’s use a few examples:
- A run play goes for a 2 yard loss. That 2 yard loss = -2.4 line yards → (-2 x 1.2)
- A run play goes for a 4 yard gain. That 4 yard gain = 4 line yards → (4 x 1)
- A run play goes for a 7 yard gain. That 7 yard gain = 3.5 line yards → (7 x 0.5)
- A run play goes for a 15 yard gain. That 15 yard gain = 0 line yards → (15 x 0)
The weighting isn’t a perfect science, but it is logical. Typically, when a run is blown up behind or at the line of scrimmage it is because the offensive line blew an assignment or was simply beaten. When a play goes for over 5 yards, then the runner is usually getting into the second level of the defense, and typically at that point is making plays and breaking tackles, particularly as the plays extend beyond 11+ yards. It makes sense to give some credit to the offensive live for plays that go between 5 – 10 yards because they open up holes, but it is dependent on the running back to see that hole and attack.
The 1-4 yard gains make logical sense to attribute 100% to the offensive line because of the push they generate. There are not typically big holes created on these plays, and the running back is simply following behind the line.
So, now that we understand how this metric applies to offensive lines, we need to apply it to defensive lines. It is important to first understand the offensive side so that you can figure out the defensive side of the ball. For the defensive line, this is the amount of yards they allowed the offensive line to generate on those run plays.
Hence, the more yards allowed, the worse the defense performed.
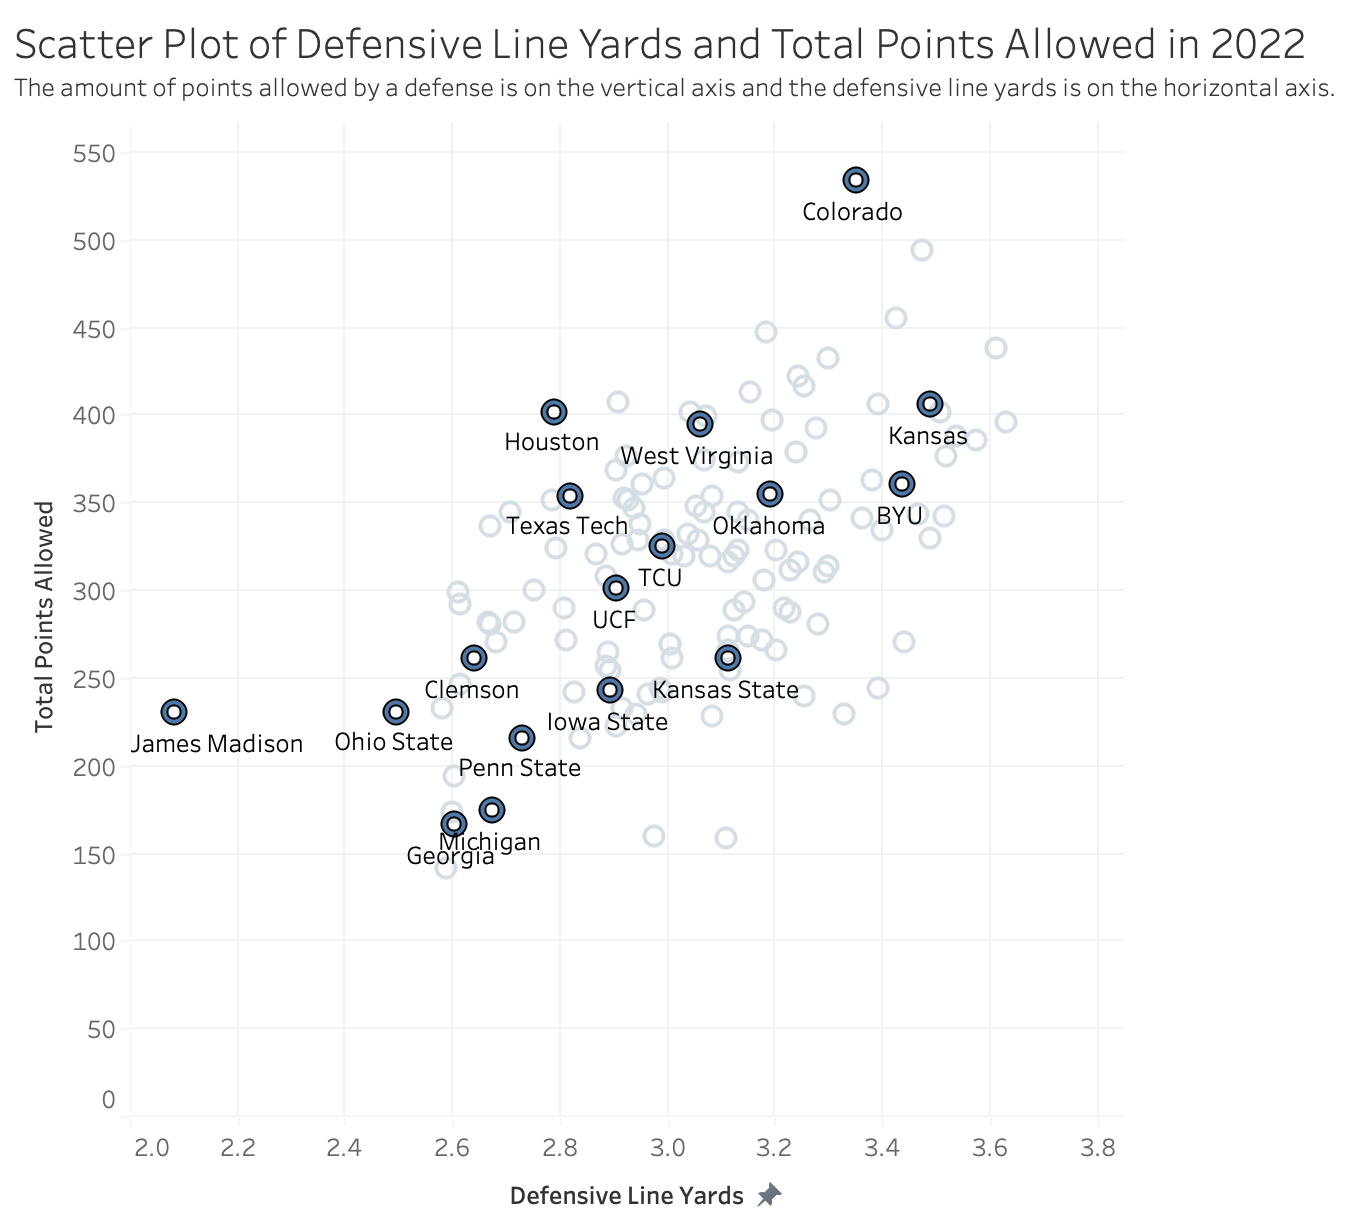
The metric can be viewed in total defensive line yards (i.e. how many offensive line yards did a defensive line allow in the year) or in an average line yards per run play. The graphs I display following show the metric in the latter view.
In the scatter plot, you’ll see that Georgia is near one end while BYU is on the other. I pointed out Georgia in order to help the viewer understand and relate this metric. Georgia’s defensive line yards allowed per run play was much lower than BYU’s. That resonates with what we saw all year. Georgia’s defense was one of the better defenses in the country last year on their way to the national title. In short:
- Georgia’s 2022 defensive line = Great – Like the Great Wall of China. Nothing is getting through it.
- BYU’s 2022 defensive line = Imagine it was a matador with nothing for defense but a piece of cloth, and the bull won every time.
Other observations about the defensive line yards performance from 2022:
- Oklahoma performed inadequately. They were not among the poorest of the poor, but they were not average. Interesting to think about given they were among the top in tackles for loss.
- TCU has continued to show up as performing mediocre in most of these metrics. That might be an indicator that BYU does not need a stellar defensive line to be very competitive in the Big 12, but they would need a stellar defensive line to win at the highest levels.
- Kansas State was not among the best in the Big 12. BYU dodged one of the last bullets that could have been fired at them via the schedule this year. I’m sure BYU will play Kansas State next year, but for now they can be glad they won’t play this year.

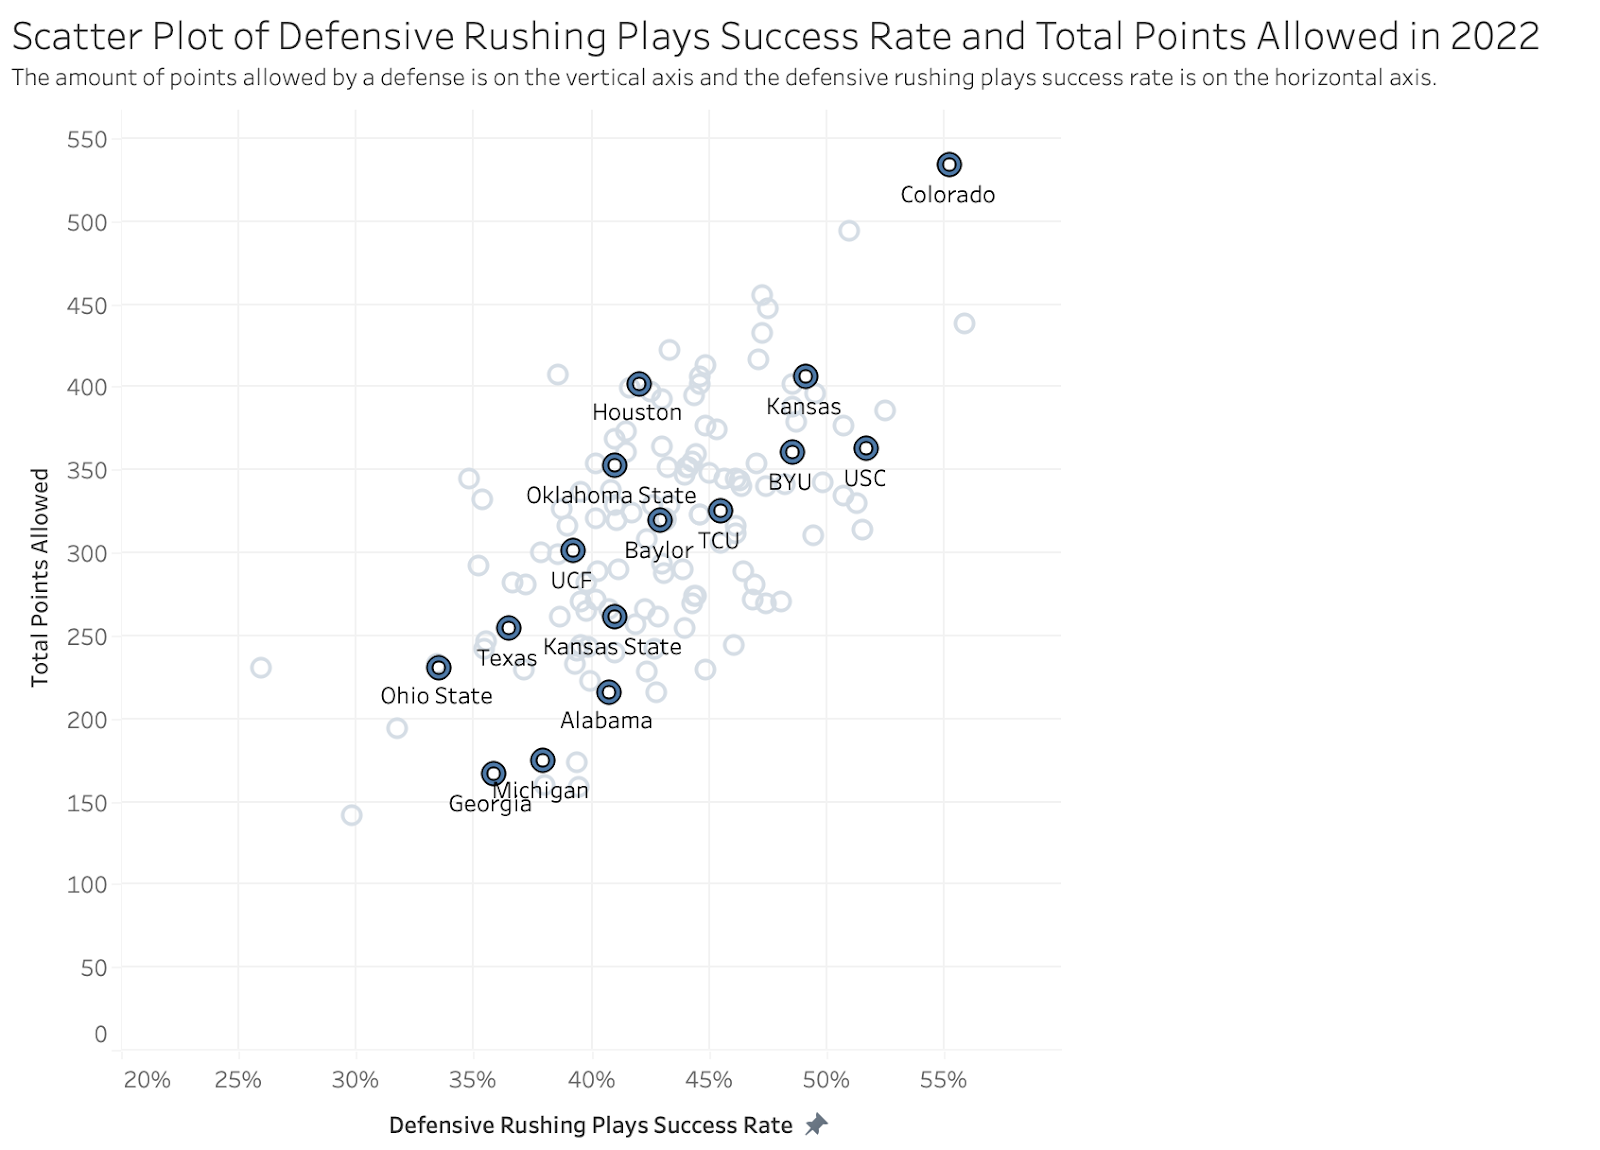
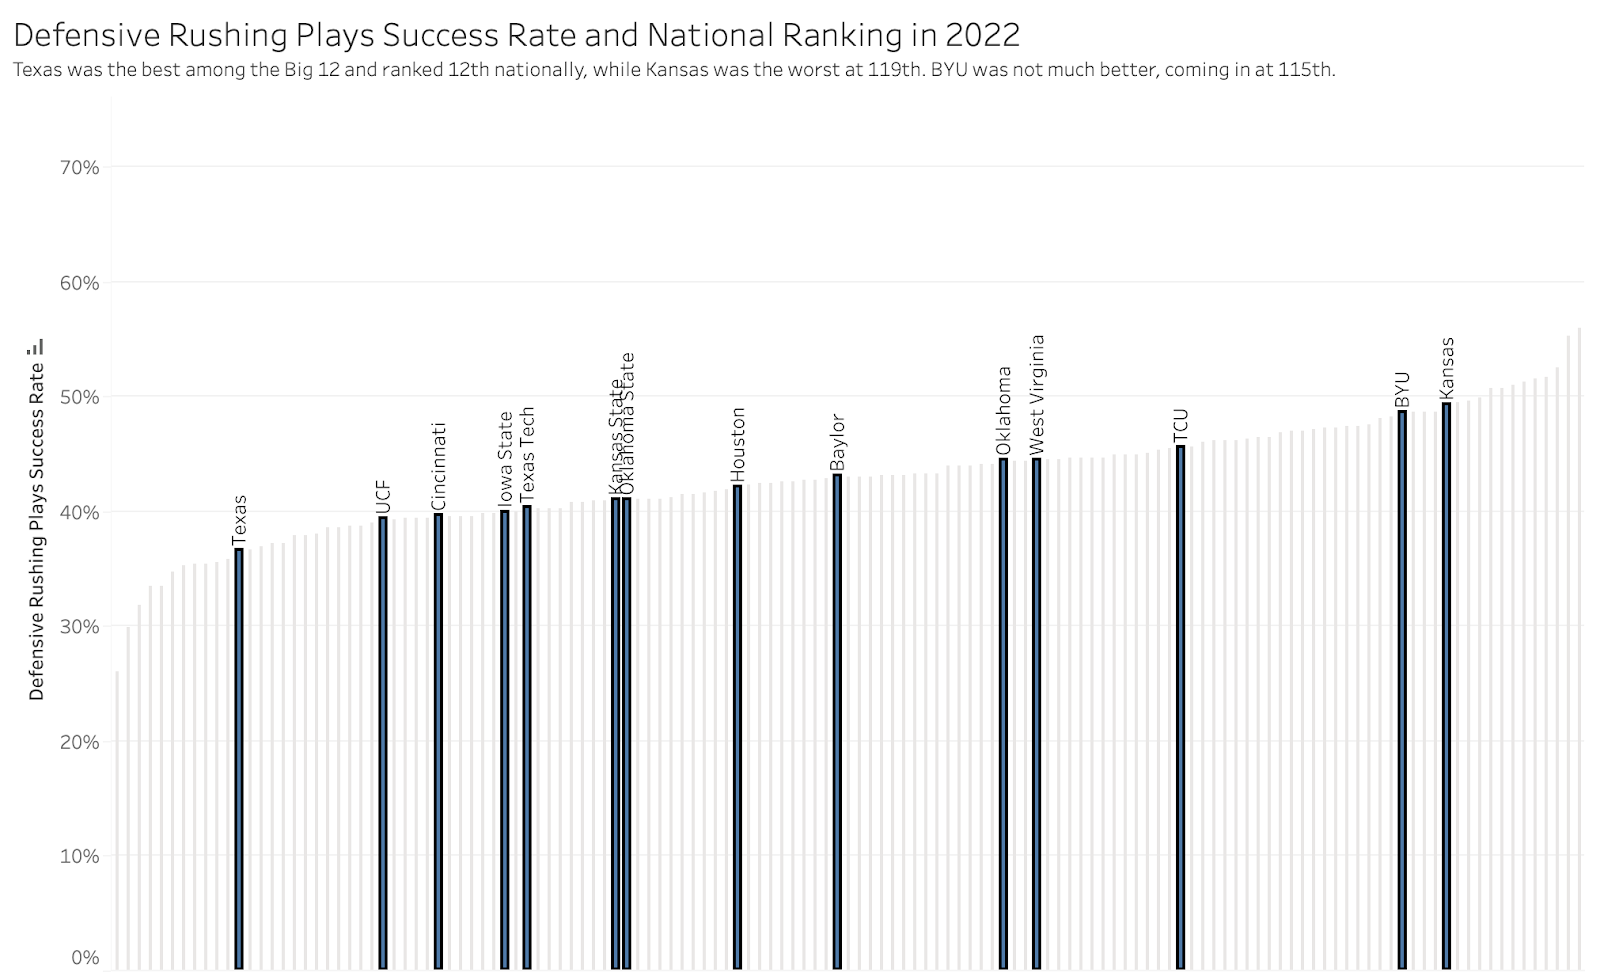
Defensive Rushing Plays Success Rate
Like Defensive Line yards, Defensive Rushing Plays Success Rate bears repeating. It is an efficiency metric pertaining to running that determines the success of a play. Successful plays meet one of the following criteria:
- the offense scored
- 1st downs which gain at least 50% of the yards to go
- 2nd downs which gain at least 70% of the yards to go
- 3rd and 4th downs which gain at least 100% of the yards to go
The lower the defense success rate, the better the defense as it was better at preventing the opposing offense from successful yard gainage.
Now, I keep highlighting Colorado as a way to benchmark some of the worst performance in all FBS. Colorado was one of the worst FBS teams last year. Possibly the worst.
Having said that, BYU’s defensive success rate against rushing plays was not great. Coming in at 49%, they were 115th in the country. This will not surprise the BYU fan. It was a coin toss, that the opposing offense would have a 2nd and short yardage situation (2nd and 3, or 2nd and 4), and if they didn’t already get the first down on 2nd, then they would be facing about a 3rd and 1 or 3rd and 2.
Look at a team like Texas, which was best in the Big 12 last year. On rushing plays, almost 65% of the time, they were forcing teams into situations like 2nd and 8 or 3rd and 6. Granted, Texas was far and away the best Big 12 team last year in this metric. But, over half of the league was better than FBS average.
To me, this metric is about limiting the gains of the opposing offense. No defense is ever going to hold an offense to negative rushing yards (or, at least it is rare). You might give up 2 or 3 yards, but better than giving up 6 or 7 on first down. This metric also shows up in games like Notre Dame, when BYU could not get Notre Dame off of the field in key spots, particularly the last drive of the game when BYU really needed the ball back.
I’m convinced that if BYU had an average defense last year, that BYU would have won 10+ games and Jaren Hall could have thrown nearly 40 touchdowns. And, he would have received some Heisman consideration. If only BYU’s defense could have got off of the field sooner. And it starts with the defensive line.
With all of this analysis, I need to acknowledge that I am a mere fan. The coaches and players deserve our respect. Not every player and coach is going to succeed. Sports is a zero sum game with winners AND losers, and sometimes our coaches and players are on the losing side. They deserve my respect for even being in the position to be on the field while I am at home watching them. So, this analysis, while not completely objective, is simply a fan’s analysis, and would never intend to message that I could have done better than coaches and players last year.
Sometimes the fan boards are filled with people who disparage coaches, say they are not bright, etc…That’s ignorant is what it is. I think it is possible to disagree with the coach’s philosophy, objectively state that performance needed to improve, and yet respect the coach and player all the same.
WIth that said, I am looking forward to this year’s defensive line and watching for improvement. If there is one metric I would like them to improve in 2023, it would be the defensive rushing plays success rate. Notice where Georgia, Ohio State, and Michigan performed in 2022…Perform well in this metric, and the defensive line is well on its way to having a successful season.
Note: Thank you CollegeFootballData.com and cfbfastR